

Want to know when your business will stop losing money and start making it? That’s where break-even analysis comes in. It’s a simple yet powerful way to figure out how much revenue you need to cover your costs. By calculating your break-even point, you can:
- Determine how many units to sell or dollars to earn to avoid losses.
- Fine-tune pricing strategies and manage costs effectively.
- Set realistic sales goals and measure profitability.
Break-even analysis focuses on three key elements: fixed costs (expenses like rent that don’t change), variable costs (expenses that increase with sales, like materials), and the contribution margin (what’s left after covering variable costs). This not only helps you make smarter decisions but is also essential for convincing investors and lenders of your business’s viability.
Here’s what the article covers:
- How to calculate your break-even point in units and dollars.
- The role of fixed and variable costs in your business.
- Using contribution margin to assess profitability.
- Practical examples to apply this to your business.
Whether you’re starting a new venture or launching a product, break-even analysis ensures you’re making decisions based on clear data, not guesswork.
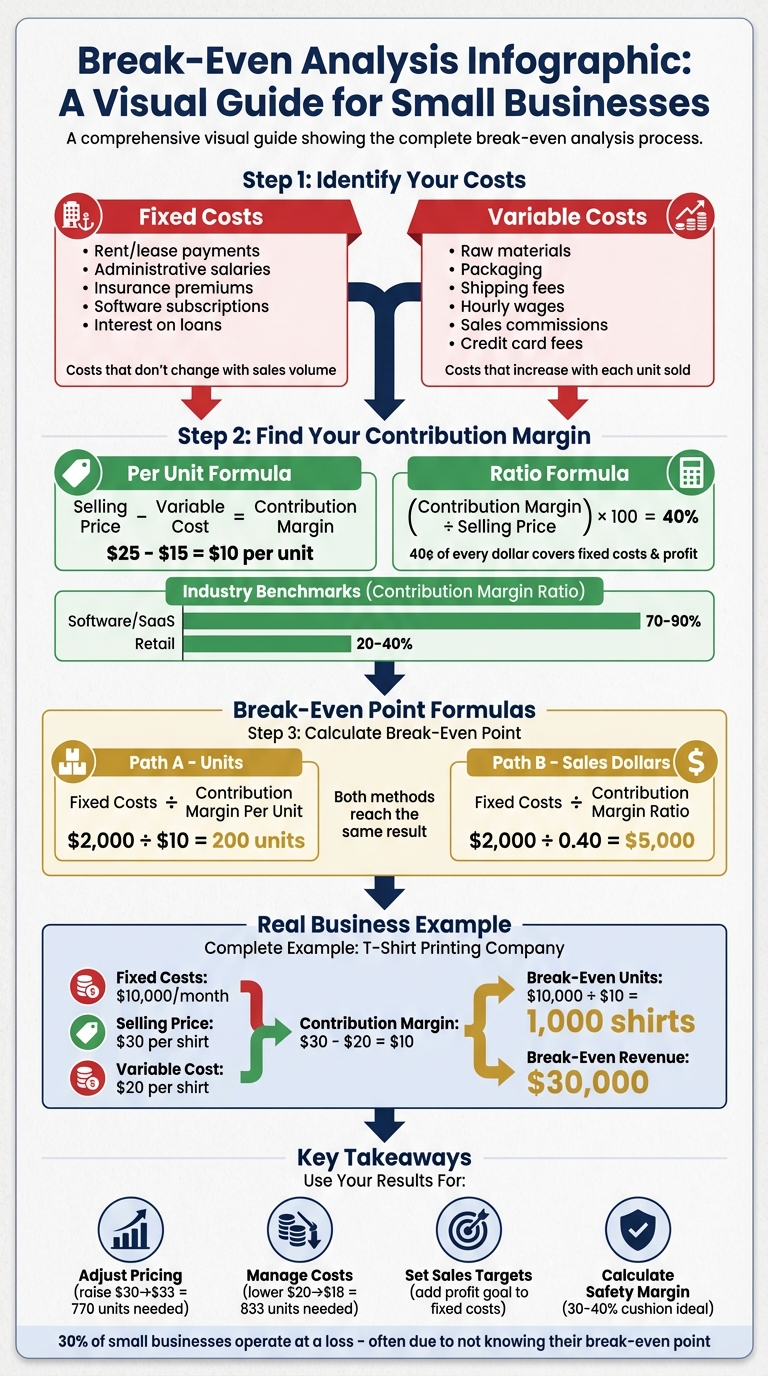
Break-Even Analysis Calculation Guide for Small Businesses
How to Calculate Breakeven Point (EASY EXAMPLE)
sbb-itb-85dd802
Understanding Costs in Break-Even Analysis
To calculate your break-even point, you first need to grasp the two key cost categories that influence your business: fixed costs and variable costs.
Michael Iverson from Trillium Financial explains, "If you don’t understand the relationship between your fixed and variable costs, achieving financial success in your business will be challenging".
Let’s break these down further.
Fixed Costs
Fixed costs are the expenses your business incurs regardless of how much you sell or produce. These are the baseline costs required to keep your business running, even during periods with no revenue. The U.S. Small Business Administration defines fixed costs as:
"Fixed costs are costs incurred during a specific period of time that do not change with the increase or decrease in production or services".
Examples of fixed costs include:
- Rent or lease payments
- Administrative salaries
- Insurance premiums
- Software subscriptions
- Interest on business loans
Here’s a quick way to identify a fixed cost: Would you still have to pay this expense if you made zero sales today? If the answer is yes, it’s a fixed cost.
For expenses billed quarterly or annually, you can break them down into monthly amounts for better clarity. For instance, if your annual liability insurance costs $3,600, that’s $300 per month. Keep in mind that some costs, like utilities, may have both fixed and variable components. For example, utilities might include a base fee (fixed) plus charges based on usage (variable). Separating these components is crucial for accurate calculations, a task often managed through strategic financial leadership.
Now let’s shift to costs that change with your sales volume – variable costs.
Variable Costs
Variable costs, as the name suggests, fluctuate based on your production or sales levels. Block Advisors defines variable costs as:
"Variable cost refers to expenses that change in proportion to how much your business produces or sells. These costs rise as production increases and fall as production decreases".
To determine if an expense is variable, ask: Does this cost increase every time I sell one additional unit? If the answer is yes, it’s a variable cost.
Examples of variable costs include:
- Raw materials
- Packaging
- Shipping fees
- Hourly wages for production labor
- Sales commissions
- Credit card processing fees
It’s important to note that salaried employees fall under fixed costs, while hourly workers are considered variable costs since their wages depend on the level of production or sales.
Understanding the distinction between these two types of costs is critical for conducting an accurate break-even analysis. Both play a major role in determining how much you need to sell to cover your expenses.
Calculating Contribution Margin
The contribution margin represents the revenue left over after covering all variable expenses. This figure is crucial because it shows how much money is available to cover your fixed costs and, eventually, to generate profit.
"The contribution margin is the foundation for break-even analysis used in the overall cost and sales price planning for products." – Investopedia
Here’s how it works: when you make a sale, the revenue first goes toward variable costs. Whatever remains contributes to fixed costs. Once those fixed costs are fully paid, every additional dollar of contribution margin becomes pure profit.
You can calculate the contribution margin in two ways: per unit and as a ratio. Both methods provide valuable insights into your business’s financial health and help determine your break-even point.
Contribution Margin Per Unit
The contribution margin per unit reveals how much each individual sale contributes toward covering fixed costs. The formula is simple:
Contribution Margin Per Unit = Selling Price Per Unit – Variable Cost Per Unit
For example, imagine you sell handmade candles for $25 each. The variable costs (materials like wax and wicks, plus packaging and shipping) add up to $15 per candle. Using the formula, the contribution margin per unit is $10 ($25 – $15). This means every candle sold brings you $10 closer to covering your fixed expenses.
If your variable costs are higher than your selling price, the contribution margin will be negative. This indicates a loss on every sale – a clear signal to either raise prices or cut variable costs.
Contribution Margin Ratio
While the per-unit margin gives you a dollar amount, the contribution margin ratio expresses this as a percentage of the selling price. This ratio is particularly useful for analyzing your break-even point in terms of total sales revenue.
Contribution Margin Ratio = (Contribution Margin Per Unit ÷ Selling Price Per Unit) × 100
Using the candle example, the contribution margin ratio would be 40% ($10 ÷ $25 × 100). This means that for every dollar of sales revenue, 40 cents goes toward covering fixed costs and generating profit.
"Your contribution margin tells you if you need to raise prices or lower costs. Your company can decrease the number of units sold to break even if you increase the margin." – Jeremy A. Johnson, CPA
Different industries have varying benchmarks for contribution margin ratios. For instance, software and SaaS companies often enjoy ratios between 70–90% due to minimal variable costs, while retail businesses typically range from 20–40% because of higher product costs. Knowing how your business stacks up can help you assess whether your pricing and cost structure are competitive.
Even a 1% improvement in your contribution margin ratio can directly boost your profitability. Small adjustments, like negotiating better supplier rates or tweaking your pricing, can make a noticeable difference to your bottom line.
Break-Even Point Formulas
Once you’ve figured out your contribution margin, the next step is calculating your break-even point (BEP). This is the point where your total revenue matches your total costs, leaving you neither profit nor loss. Knowing how to calculate this is essential for applying break-even analysis effectively in business. For more tailored support, consider consulting with licensed pros who specialize in small business advisory.
There are two ways to calculate your BEP: by units sold or by total sales dollars. Both methods rely on your fixed costs and contribution margin but offer different perspectives, helping you make informed decisions. Here’s how each method works:
Break-Even Point in Units
This approach helps you determine how many items or services you need to sell to cover your costs. The formula is:
Break-Even Point in Units = Total Fixed Costs ÷ (Selling Price per Unit – Variable Cost per Unit)
Let’s break it down with an example. Imagine you run a candle business. Your fixed costs (like rent, utilities, and insurance) total $2,000 per month. Each candle sells for $25, and the variable cost per candle is $15. That gives you a contribution margin of $10 per unit. Using the formula:
$2,000 ÷ $10 = 200 candles
This means you need to sell 200 candles every month to break even. It’s a good idea to revisit this number regularly and even add a 10% buffer to account for unexpected costs.
"Your break-even point is the magical number of units you need to sell in order to start making a profit." – Trailhead Accounting Solutions
Now, let’s explore how to calculate your break-even point in terms of sales dollars, which can be especially helpful for broader financial goals.
Break-Even Point in Sales Dollars
If you have multiple product lines or want to set overall revenue goals, calculating the break-even point in sales dollars can provide a clearer picture. The formula is:
Break-Even Point in Sales Dollars = Total Fixed Costs ÷ Contribution Margin Ratio
The contribution margin ratio represents the percentage of each sales dollar that contributes to covering fixed costs. Using the same candle business example, with a $10 contribution margin on a $25 sale, the ratio is 40%. Plugging the numbers into the formula:
$2,000 ÷ 0.40 = $5,000
This means you need $5,000 in monthly sales to break even. Considering that 48% of business leaders in 2025 identified increasing revenue as their top priority, understanding this calculation is vital for planning and evaluating new opportunities.
Interestingly, both methods lead to the same result – 200 candles sold at $25 each equals $5,000. The choice between the two depends on whether you’re focusing on unit sales or overall revenue. Use the method that aligns best with your business goals.
Applying Break-Even Analysis to Small Businesses
Put these calculations to work using your own business data to fine-tune pricing, control costs, and plan for growth.
Example Calculation
Let’s break it down with an example of a custom t-shirt printing company:
- Fixed costs: $10,000 per month (rent, equipment leases, salaries, insurance)
- Selling price per unit: $30 per t-shirt
- Variable cost per unit: $20 per t-shirt (materials, printing supplies, shipping)
Start by finding the contribution margin: $30 – $20 = $10 per t-shirt. This means that for every shirt sold, $10 goes toward covering fixed costs.
Next, calculate the break-even point in units: $10,000 ÷ $10 = 1,000 t-shirts. Selling 1,000 shirts per month covers all expenses.
To find the break-even point in dollars, you can either multiply break-even units by the selling price (1,000 × $30 = $30,000) or use the contribution margin ratio: $10 ÷ $30 ≈ 33%. Then, divide fixed costs by the ratio: $10,000 ÷ 0.33 ≈ $30,000.
These numbers provide a foundation for decisions around pricing, cost management, and sales targets.
Using Results for Decision-Making
Once you know your break-even figures, you can make smarter business choices by adjusting key variables:
- Adjust Pricing: Even small price increases can significantly lower your break-even point. For instance, raising the price from $30 to $33 boosts the contribution margin to $13. This reduces the break-even point to about 770 units – a meaningful difference.
- Manage Costs: Test different cost scenarios to see their impact. Lowering variable costs from $20 to $18 per t-shirt increases the contribution margin to $12, reducing the break-even point to roughly 833 units. Shifting some fixed costs to variable costs – like outsourcing non-core tasks – can also add flexibility.
- Set Sales Targets: To plan for profit, include your target profit in the calculation. For example, if you aim for $5,000 in monthly profit, the required units would be:
($10,000 + $5,000) ÷ $10 = 1,500 units - Calculate the Margin of Safety: This metric shows how much sales can drop before hitting break-even. Use the formula: (Current Sales – Break-Even Sales) ÷ Current Sales. A cushion of 30% to 40% above break-even is ideal, while less than 10% leaves you vulnerable.
"Your breakeven point isn’t just an accounting metric; it’s a decision-making powerhouse." – Allied Tax Advisors
Revisit your break-even analysis quarterly or whenever costs change – like rent hikes, material price shifts, or new hires – so your financial plans stay accurate.
For tailored advice on incorporating break-even analysis into your business strategy, reach out to TC Advisors. They offer CPA services and consulting specifically designed for small businesses.
Conclusion
Break-even analysis takes the guesswork out of financial planning by providing clear insights into your revenue and costs. This clarity is crucial, especially when you consider that nearly 30% of operating small businesses are currently losing money. Often, this happens because they lack a firm grasp of this essential metric.
By applying these formulas, you can set achievable sales targets, experiment with pricing strategies, and identify cost-cutting opportunities. As the U.S. Small Business Administration puts it:
"The break-even analysis will help you start your business based on facts".
This data-driven approach isn’t just for startups. It’s equally important when launching a new product, opening a second location, or tweaking your business model.
Keep in mind, though, that your break-even point isn’t static. Changes in expenses, supplier rates, or market conditions can shift it. That’s why it’s wise to revisit your break-even numbers quarterly or whenever significant costs change. Adding a 10% buffer for unexpected expenses can also provide a helpful safety net.
With nearly half (48%) of business leaders focusing on revenue growth by 2025, understanding your break-even point offers a competitive edge. It equips you to make informed decisions – whether it’s determining how many units to sell, adjusting prices, or evaluating the financial viability of a new product.
For tailored advice and expert CPA support, reach out to TC Advisors.
FAQs
What costs should I include in my break-even analysis?
In a break-even analysis, you need to account for two key types of costs: fixed costs and variable costs.
- Fixed costs are expenses that stay the same no matter how much you sell. Think of things like rent, salaries, or insurance. These don’t change, even if your sales skyrocket or hit a slump.
- Variable costs, on the other hand, shift depending on your production or sales volume. Examples include raw materials, direct labor, and commissions – costs that grow as you sell more.
By including both fixed and variable costs, you can pinpoint the exact moment when your total revenue matches your total expenses. That’s your break-even point, a critical figure for understanding your business’s financial health.
How do I handle mixed costs like utilities in break-even math?
To account for mixed costs, such as utilities, in break-even analysis, you need to divide them into fixed and variable parts. Fixed costs, like a standard monthly fee, stay the same and should be grouped with other fixed expenses. On the other hand, variable costs, like charges based on usage, change with consumption and should be added to your variable cost per unit. Properly categorizing these elements ensures your break-even calculation accurately represents the dual nature of utility costs.
How often should I recalculate my break-even point?
You should revisit and recalculate your break-even point on a regular basis, particularly after any major shifts in costs, pricing, or sales volume. Many small business owners choose to reassess it quarterly or whenever there are significant changes. Keeping this figure updated ensures more precise financial planning and helps your business stay aligned with its profitability targets.


