

Cash flow issues cause 82% of business failures, making them the most critical focus during financial due diligence. While profits may look good on paper, cash flow reveals a company’s true financial health. This process evaluates liquidity, sustainability, and the ability to meet obligations like payroll, debt, and supplier payments – factors essential for long-term success.
Key insights:
- Cash flow matters more than profit: Net income can hide liquidity risks, but cash flow shows operational reality.
- Common issues: Irregular cash patterns, slow customer payments, and excessive debt signal potential problems.
- Key metrics: Days Sales Outstanding (DSO), Inventory Turnover, and CapEx-to-Depreciation ratios help assess cash flow health.
- Practical solutions: Speed up collections, extend payment terms, and use a 13-week cash flow forecast to improve liquidity.
Thorough cash flow analysis ensures informed decisions, reduces risks, and helps buyers identify businesses that are financially stable.
Corporate Finance Explained | Financial Due Diligence
sbb-itb-85dd802
Common Cash Flow Problems in Financial Due Diligence
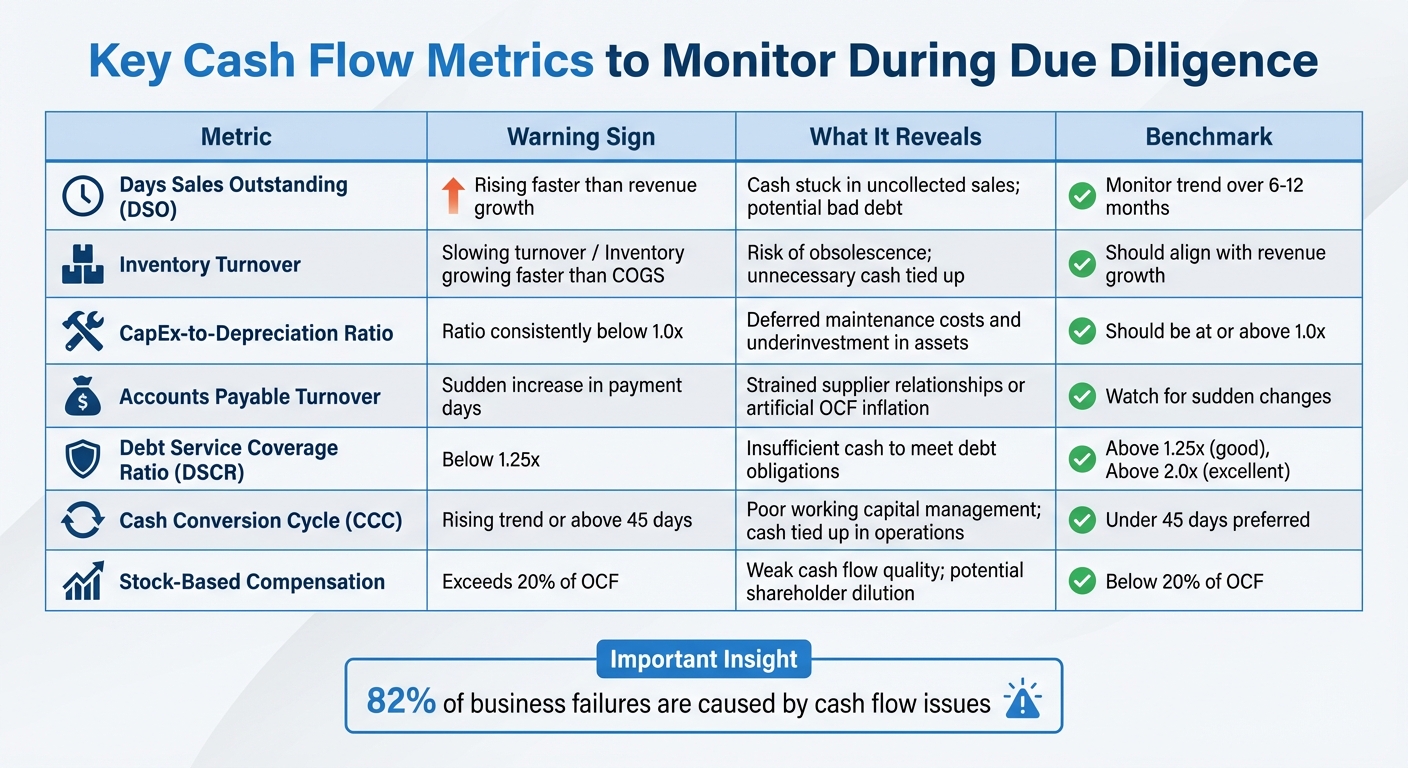
Key Cash Flow Metrics and Warning Signs in Financial Due Diligence
When conducting due diligence, cash flow issues can often lurk beneath a company’s apparent profitability. These challenges might not be obvious at first glance, but they can signal deeper operational problems. Spotting these red flags is essential for buyers and investors to distinguish between businesses with genuine financial health and those that might be teetering on instability.
Irregular Cash Flow Patterns
Inconsistent cash flow patterns are a major warning sign that something might be off operationally. For example, if Accounts Receivable grows faster than revenue, it often means sales are being booked without actually collecting cash. This can stem from overly aggressive sales tactics, lax credit policies, or customers who are struggling to pay on time.
Some companies attempt to artificially boost their Operating Cash Flow (OCF) by delaying payments to suppliers or speeding up collections. While this might temporarily improve cash flow, it can lead to long-term problems. It’s worth noting that the Financial Reporting Council frequently flags cash flow statements as a top issue in corporate reports, underscoring how common these irregularities are.
End-of-month balances can be misleading. A company might appear stable when looking at monthly reports, but daily cash fluctuations can reveal hidden struggles. Intramonth cash shortages, for instance, can show that a business is barely staying afloat. A variance of more than 3% in a "Proof of Cash" reconciliation should raise concerns and prompt further investigation.
Slow Customer Payments and Excessive Debt
Beyond irregularities, liquidity problems often arise from delayed customer payments and mounting debt. A steady increase in Days Sales Outstanding (DSO) over six to twelve months can indicate poor collection practices or financially strained customers. As FinancialModelsLab puts it:
"If a business can’t consistently turn sales into cash, it doesn’t matter how high its reported profits are".
High levels of debt only worsen these liquidity challenges. Even a company with positive EBITDA might struggle to meet its debt obligations if it doesn’t have enough Cash Available for Debt Service (CADS). Lenders generally look for a Debt Service Coverage Ratio above 1.25x, with anything lower signaling potential trouble if revenue dips.
Hidden liabilities, like Supply Chain Finance or factoring arrangements, can also mask deeper liquidity issues. These programs pull future cash forward or extend payables, creating the illusion of stronger OCF while increasing long-term instability. Similarly, when Stock-Based Compensation exceeds 20% of OCF, it could signal that the company’s cash flow quality isn’t as strong as it appears due to potential shareholder dilution.
Profitable on Paper but Cash-Strapped
Accrual accounting can make a company look profitable on paper by recognizing revenue at the time of sale, not when cash is collected. But weak collections and poor inventory management can lead to cash shortages. For instance, if Accounts Receivable or inventory grows faster than revenue, cash becomes "trapped" in the operating cycle.
Several factors contribute to this issue:
- Inefficient collections result in rising DSO and cash stuck in receivables.
- Poor inventory management ties up cash in overstocked or unsold goods, increasing the risk of obsolescence.
- Rapid expansion often demands significant upfront cash for expenses like salaries, rent, and production, creating temporary liquidity challenges.
Another concerning practice is underinvesting in maintenance capital expenditures (CapEx). Companies might defer repairs or equipment replacements to boost short-term cash flow, but this can lead to significant future costs. A CapEx-to-Depreciation ratio consistently below 1.0x suggests the company isn’t maintaining its asset base properly – a risk that could eventually fall on the buyer.
Key Metrics to Watch
Certain financial metrics can provide valuable insights into cash flow health during due diligence:
| Metric | Warning Sign | What It Reveals |
|---|---|---|
| Days Sales Outstanding (DSO) | Rising faster than revenue growth | Cash stuck in uncollected sales; potential bad debt |
| Inventory Turnover | Slowing turnover / Inventory growing faster than COGS | Risk of obsolescence; unnecessary cash tied up |
| CapEx-to-Depreciation | Ratio consistently below 1.0x | Deferred maintenance costs and underinvestment |
| Accounts Payable Turnover | Sudden increase in payment days | Strained supplier relationships or artificial OCF inflation |
These metrics act as critical checkpoints, helping to uncover a company’s true liquidity position and ensuring that buyers have a clear understanding of its financial sustainability.
Key Metrics for Analyzing Cash Flow
Once you’ve pinpointed cash flow issues, it’s time to dive into the numbers that really matter. Not all financial figures are created equal – some give a clear picture of a business’s health, while others can be misleading or manipulated. Focusing on the right metrics can reveal a company’s true liquidity and operational performance.
Operating Cash Flow and Free Cash Flow
Operating Cash Flow (OCF) highlights the actual cash generated from a company’s day-to-day operations. Unlike Net Income, which factors in non-cash items like depreciation or changes in working capital, OCF zeroes in on liquidity. But OCF alone doesn’t tell the full story. A company might generate strong OCF but still fall short when it comes to funding essential investments.
That’s where Free Cash Flow (FCF) comes into play. FCF is calculated by subtracting Capital Expenditures (CapEx) from OCF, giving a clearer picture of how much cash is available for debt repayment, dividends, or reinvestment. To dig deeper, it’s useful to separate mandatory maintenance CapEx from discretionary growth CapEx. As Patrick O’Connell, CPA and Managing Director of Transaction Services, puts it:
"Free Cash Flow (FCF) and Cash Available for Debt Service (CADS) are not just advantageous – they are vital".
Additionally, keep an eye on the CapEx-to-Depreciation ratio. If it consistently stays below 1.0x, it could signal underinvestment in assets, a strategy sometimes used to temporarily inflate cash flow.
Beyond these metrics, it’s essential to evaluate how efficiently a business converts its investments into cash. That’s where the Cash Conversion Cycle comes in.
Cash Conversion Cycle
The Cash Conversion Cycle (CCC) measures how long it takes for a company to turn its investments in inventory and resources into cash from sales. This metric is a solid indicator of operational efficiency and working capital management. Many investors look for businesses with a CCC under 45 days.
The CCC is made up of three key components:
- Days Inventory Outstanding (DIO): How long inventory sits before being sold.
- Days Sales Outstanding (DSO): How quickly the company collects payments from customers.
- Days Payable Outstanding (DPO): How long the company takes to pay its suppliers.
The formula is simple: CCC = DIO + DSO – DPO. A rising CCC can signal trouble, even if net income looks strong. For example, high DIO might mean inventory is piling up, high DSO could point to slow collections, and a low or shrinking DPO might indicate suppliers are demanding faster payments.
During due diligence, it’s useful to stress-test the CCC. For instance, simulate a 15-day extension on accounts receivable to see how it impacts working capital needs. As S&P Ventures notes:
"Working capital management separates good operators from great ones".
For a closer look at short-term liquidity, consider using a 13-week cash flow forecast.
13-Week Cash Flow Forecasting
While long-term forecasts are great for strategic planning, they often overlook immediate cash flow challenges. A 13-week cash flow forecast provides a detailed, week-by-week view of cash inflows and outflows over a fiscal quarter. This approach offers a clear snapshot of a company’s ability to meet short-term obligations – like payroll, supplier payments, and taxes.
This tool is especially critical for businesses with significant inventory, where there’s often a lag between purchasing stock and collecting revenue. Richard Branson captured the importance of this perfectly:
"Never take your eyes off of the cash flow because it’s the life blood of the business".
Scenario modeling is a powerful way to use this forecast. By building best-case, base-case, and worst-case scenarios, you can adjust key drivers like sales volume, gross margins, and CapEx timing. This approach helps test debt covenants and liquidity thresholds. As Michael Peck from Ramp explains:
"Scenario planning turns uncertainty into actionable insight. When conditions shift, you’ll already know which levers to pull to maintain stability".
Additionally, aligning vendor payment schedules with expected cash inflows can help smooth out timing gaps and avoid temporary shortages. Considering that poor cash flow management is responsible for 82% of business failures, this level of detailed planning can make or break an acquisition.
How to Perform Cash Flow Analysis: Step-by-Step
Learn how to turn cash flow metrics into actionable insights, helping you spot potential issues before committing to a deal.
Gather and Review Historical Financial Data
Start by collecting 3–5 years of financial statements to identify patterns and potential volatility in the business’s finances. For public companies, check 10‑K and 10‑Q filings. If it’s a private business, request tax returns to confirm reported income and look for any discrepancies.
Make sure to gather reconciliation data that connects Net Income to Operating Cash Flow. This includes items like Depreciation & Amortization, Stock‑Based Compensation, and Deferred Taxes. Pay attention to anomalies, such as Stock‑Based Compensation exceeding 20% of Operating Cash Flow. Additionally, review historical balances for Accounts Receivable, Inventory, and Accounts Payable to calculate the Cash Conversion Cycle.
Don’t skip the footnotes in financial statements – they can reveal aggressive revenue recognition tactics, changes in payment terms, or hidden financing arrangements like factoring programs that might inflate operating cash flow artificially. Also, compare balance sheets from the start and end of each period to trace cash movements, such as loans or major asset purchases, that may not show up on the income statement.
Once you’ve gathered the data, the next step is to categorize cash flow activities for better clarity.
Break Down and Analyze Cash Flow Activities
Cash flow is typically divided into three categories: Operating, Investing, and Financing activities.
Operating cash flow shows whether the business can sustain itself through its core operations. A red flag here is when reported profits are high, but cash is tied up in Accounts Receivable or slow-moving inventory.
Investing activities highlight how the company manages its infrastructure. Check the CapEx-to-Depreciation ratio – if it’s consistently below 1.0x, the company might be neglecting its assets to temporarily boost cash flow.
Financing activities reveal the business’s reliance on external funding. Be cautious of companies using short-term debt to fund long-term growth or paying dividends that exceed their Free Cash Flow.
To get a clearer picture of recurring cash flow, exclude one-time events like asset sales or gains from selling minority stakes. Use trend and variance analysis to uncover potential issues. For instance, if Accounts Receivable grows by 25% while revenue only increases by 10%, it could signal overly aggressive payment terms that "borrow" from future cash flow.
After analyzing historical cash flow, the focus shifts to validating future projections and comparing them to industry standards.
Validate Projections and Compare to Industry Standards
Once you’ve reviewed the historical data, examine the company’s future cash flow projections alongside industry benchmarks. Compare past revenue and cash flow figures against previous forecasts – frequent misses raise concerns about the reliability of future projections. Look closely at assumptions around market growth, pricing, and customer retention. For example, expecting high growth in a stagnant market might not hold up.
Benchmark performance using industry metrics. A Debt Service Coverage Ratio (DSCR) above 1.25x is generally considered solid, while anything over 2.0x is excellent. Investors also prefer companies with a Cash Conversion Cycle under 45 days. If a company’s Free Cash Flow yield is 7.5% compared to an industry average of 6.5%, it could indicate the company is undervalued or generates better cash returns.
To test the strength of these projections, run scenarios like a 10% revenue drop or a 15-day delay in Accounts Receivable. This helps identify the point at which liquidity issues might arise. Given that 82% of small businesses fail due to poor cash flow management, this kind of stress-testing is essential for reducing risk before making a decision.
If you need help navigating these steps, the experts at TC Advisors offer CPA and fractional CFO services tailored to small and mid-sized businesses, ensuring every phase of financial due diligence is covered.
Solutions for Cash Flow Problems During Due Diligence
Once cash flow issues are identified during due diligence, the focus shifts to implementing practical solutions. Tackling slow cash inflows and optimizing payment processes are crucial steps in stabilizing liquidity.
Speed Up Collections and Adjust Payment Terms
Shortening accounts receivable (AR) deadlines can significantly improve liquidity. Reducing payment terms and enforcing them strictly helps lower Days Sales Outstanding (DSO). During due diligence, review communications with customers holding large balances to confirm when payments will be received. To streamline collections, categorize customers by risk – high, medium, or low – based on factors like location, industry, and payment history. This allows you to prioritize efforts where they matter most.
Switching to electronic payment methods, such as ACH or wire transfers, can also speed up cash inflows. At the same time, extending Days Payable Outstanding (DPO) preserves liquidity by delaying outflows. In 2022, only 33% of B2B payments were made via check, a steep drop since 2019. Additionally, 75% of businesses reported that paying key suppliers electronically improved their operations. Leveraging tools like just-in-time payment systems, which release funds at the last possible moment without incurring penalties, can further support cash flow.
Use Fractional CFO Services for Expert Guidance
Operational tweaks aside, a fractional CFO can provide the expertise needed to refine your cash flow strategy. These professionals excel at identifying financial gaps, aggressive accounting practices, and operational risks that may go unnoticed by internal teams. They also assist in organizing documentation, addressing reporting gaps, and running scenario planning to validate and refine projections under various market conditions.
Fractional CFOs play a key role in optimizing the Cash Conversion Cycle (CCC) by identifying areas where cash is tied up, such as inventory or overdue receivables. Their ability to produce clean, professional financial reports builds trust with lenders and investors, often resulting in lower interest rates and better deal terms. As Brad Jungers, Founder & CEO of CFO Insights, explains:
"When they trust your financials, your interest expense is going to go down".
Cost is another advantage of fractional CFOs. Their annual fees typically range from $48,000 to $120,000, compared to $300,000 to $600,000 for a full-time CFO. TC Advisors, for instance, offers fractional CFO services tailored to small and mid-sized businesses, providing strategic financial leadership during critical due diligence periods.
Apply Scenario Forecasting and Cash Flow Tools
Fractional CFOs also enhance forecasting accuracy, a crucial element of liquidity management. A 13-week rolling cash forecast is widely recognized as the gold standard for short-term planning during due diligence, offering enough visibility to identify issues while grounding decisions in actual data. Using the "Direct Method" to track cash inflows and outflows is generally more intuitive than relying on the "Indirect Method", which is derived from profit and loss statements. Forecasts should be based on historical AR aging and typical customer payment patterns, avoiding over-reliance on optimistic sales projections.
Stress-testing these forecasts is equally important. For example, simulate scenarios like a 10% drop in revenue, a 5% rise in Cost of Goods Sold, or a 15-day delay in receivables. Start by mapping essential outflows – such as payroll, rent, taxes, and debt service – on your calendar, then overlay revenue projections. Including a contingency line for unexpected expenses ensures the forecast remains conservative and realistic. Brad Jungers highlights the value of accurate forecasting:
"The better your cash forecast is, the less desperate your financing decisions get. Desperation is expensive".
Monitoring the Cash Conversion Cycle during this process is critical, as a lengthening cycle could indicate future liquidity problems.
Conclusion
Effective due diligence begins with a solid cash flow analysis – highlighting actual liquidity rather than relying on accounting interpretations. While net income can be influenced by subjective factors, cash flow offers a clear, undeniable picture. For small businesses navigating transactions, understanding the distinction between profitability on paper and real liquidity can make or break a deal.
Key metrics like Operating Cash Flow, Free Cash Flow, and the Cash Conversion Cycle are vital. Projections should be stress-tested to uncover potential liquidity challenges. Additionally, setting a clear working capital benchmark in the Sale and Purchase Agreement can avoid post-closing disputes and ensure adequate liquidity from Day One.
To further protect liquidity, expert advisors often conduct proof-of-cash reconciliations. This process helps uncover red flags and ensures businesses can meet debt-service requirements. For example, lenders generally expect a Debt Service Coverage Ratio of at least 1.25x, and professional guidance can help businesses meet these expectations.
TC Advisors provides fractional CFO and transaction advisory services tailored for small to mid-sized businesses. Their expertise helps identify financial gaps, optimize working capital, and create reliable forecasts that can improve deal outcomes and negotiation leverage.
A thorough cash flow review supports every phase of financial due diligence. Whether you’re buying, selling, or securing financing, managing cash flow effectively is non-negotiable. With the right preparation, tools, and expert advice, businesses can safeguard shareholder value and lay the groundwork for sustained success.
FAQs
What cash flow red flags should I verify before buying a business?
Before buying a business, keep an eye out for warning signs such as negative or inconsistent cash flow, excessive dependence on debt, overstated asset values, unstable revenue patterns, or poor cash flow management. These can point to underlying financial troubles. Spotting these risks early is key to ensuring you make a well-informed choice.
How can I tell if operating cash flow is being artificially inflated?
To spot potential artificial inflation in operating cash flow, pay close attention to working capital management and non-cash adjustments. Keep an eye out for warning signs like sudden revenue surges, irregular expense patterns, or transactions that lack proper documentation. Dive into the cash flow statement to evaluate the quality of cash flow, carefully analyzing where the cash is coming from and how it’s being used. This can help uncover any irregularities or inconsistencies.
What should a 13-week cash flow forecast include for due diligence?
A 13-week cash flow forecast is a crucial tool during due diligence. It provides a detailed breakdown of expected cash inflows – such as customer payments, prepayments, tax refunds, and interest – and cash outflows, including payroll, vendor payments, rent, taxes, and debt servicing. By organizing these projections on a weekly basis, this forecast helps pinpoint potential short-term cash shortages and liquidity needs, enabling more effective financial planning and reducing risks.


