

Tracking KPIs is essential for business success. Without them, you’re flying blind. Companies that monitor fewer than 10 key metrics are 1.5x more likely to outperform competitors. Regular reviews help identify issues early, driving faster growth and higher profits.
Key takeaways from this guide:
- Review frequency matters: Match KPI reviews to the speed of change in your business.
- Focus on fewer metrics: Tracking fewer than 10 core KPIs boosts performance.
- Ownership is critical: Assign someone to each KPI for accountability.
- Use dashboards: Real-time insights make decision-making faster and more precise.
- Balance indicators: Combine predictive (leading) and outcome-based (lagging) metrics for a full picture.
Example: A fractional CFO client in the SaaS space grew revenue from $8M to $25M in 18 months by narrowing focus to 7 KPIs, improving retention, and cutting meeting times.
This guide explains how to build a structured KPI process, analyze performance, and make data-driven improvements. Whether you’re a small business or scaling fast, these steps can help align actions with goals.
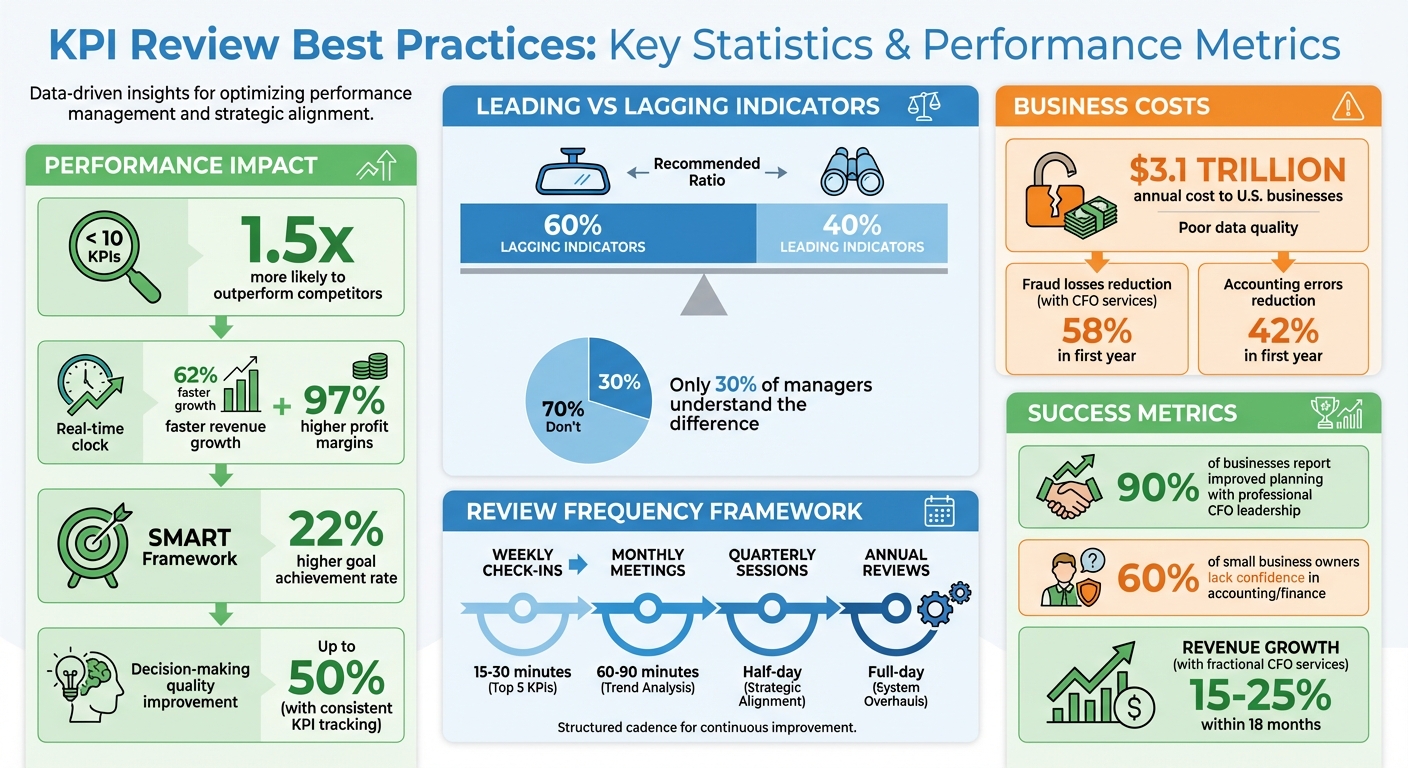
KPI Review Best Practices: Key Statistics and Performance Metrics
Are You Measuring the Right KPIs How to Track Team Performance Effectively
sbb-itb-85dd802
How to Build a KPI Review Process
A structured KPI review process ensures that your metrics remain actionable and aligned with your business needs. The trick is to match how often you review KPIs to the speed of change in your business. As Made to Measure KPIs explains:
"The frequency of reviewing KPIs should match the potential rate of change in the process being measured".
For example, website traffic during a product launch may need daily attention, while annual revenue can be reviewed quarterly.
Creating a Review Cadence
Set up tiered review schedules to address both immediate and long-term needs:
- Weekly check-ins: Spend 15–30 minutes reviewing your top 5 KPIs.
- Monthly meetings: Dedicate 60–90 minutes to analyze trends.
- Quarterly sessions: Hold half-day meetings for strategic alignment.
- Annual reviews: Reserve time for system overhauls and big-picture analysis.
This layered approach ensures you’re keeping up with urgent issues while planning for the future.
Keep your focus sharp by tracking fewer than 10 company-wide KPIs. Organizations that follow this principle outperform competitors by 1.5 times. For instance, a B2B SaaS company grew its annual recurring revenue from $8 million to $25 million in just 18 months by narrowing its focus from 47 scattered metrics to 7 core KPIs. This shift improved net revenue retention from 95% to 118% and cut leadership meeting times from 2 hours to just 20 minutes.
Assigning Ownership and Accountability
Every KPI needs a dedicated owner responsible for tracking performance and explaining any changes. Without clear accountability, metrics risk becoming passive data instead of actionable insights. Use a simple traffic light system to categorize KPIs:
- Green: On track.
- Yellow: Needs investigation.
- Red: Requires immediate action within 24 hours.
Clearly define the steps your team should take for each status, so there’s no confusion when action is needed.
Leveraging Dashboards for Real-Time Insights
Modern dashboards are essential for tracking KPIs. They connect directly to your data sources and update automatically. Visual clarity matters – place critical metrics at the top, use status indicators, and include comparisons like month-over-month or year-over-year trends. For smaller businesses, starting with sales data is often the most manageable and actionable approach.
And don’t let your KPIs go stale. As Jeremy A. Johnson, CPA, warns:
"Stale KPIs are worse than no KPIs. You should adjust for changes once a quarter".
Setting Up Review Schedules
To determine the right review frequency, ask yourself three questions: How important is this metric? How quickly can it go wrong? How fast can you fix it?. Metrics tied to fast-moving processes, like manufacturing equipment effectiveness, may require daily reviews. In contrast, metrics like customer lifetime value, which change more gradually, can be reviewed monthly.
A good example of this approach is a mid-size manufacturer that improved its Overall Equipment Effectiveness (OEE) from 62% to 87% over 12 months. They achieved this by holding daily production huddles focused on five KPIs: OEE, First Pass Yield, On-Time Delivery, Cost Per Unit, and Inventory Turnover. This shift reduced their cost per unit by 18%.
Balance leading indicators (predictive metrics like sales pipeline velocity) with lagging indicators (results like revenue). Research suggests maintaining a 60/40 ratio of lagging to leading indicators. Leading indicators give you the chance to act before issues affect your bottom line. For example, a drop in sales pipeline coverage below 3× your quota could signal missed revenue targets in 60–90 days – but catching it early allows for corrective action.
Streamlining KPI Reviews
Rather than scheduling separate meetings, build KPI reviews into existing workflows. For instance, add a 10-minute KPI check to your Monday leadership meetings and include a dashboard screenshot in your monthly board updates. A consistent, straightforward review process is more effective than an elaborate one that gets postponed. This approach addresses short-term issues while laying the groundwork for long-term alignment.
Checking KPI Alignment with Business Goals
After setting up regular reviews, ensure each KPI ties directly to your strategic goals. Use the "So What?" Test: If improving this metric doesn’t clearly advance your business objectives, it’s time to drop it. Kamyar Shah, Fractional COO/CMO at World Consulting Group, explains:
"When everything is a priority, nothing is a priority. This ‘dashboard dump’ approach leads to analysis paralysis".
Consider the example of a consulting firm that increased its EBITDA margin from 3% to 19% by focusing on five financial KPIs: Utilization Rate, Realization Rate, Average Bill Rate, Revenue Per Employee, and Project Margin. By narrowing their focus, they improved utilization from 58% to 78%.
Conduct quarterly alignment checks to ensure your KPIs reflect current market conditions and business priorities. For instance, if your focus shifts from customer acquisition to retention, adjust your metrics accordingly – like tracking net revenue retention instead of new customer counts. Companies using SMART KPIs (Specific, Measurable, Achievable, Relevant, Time-bound) report a 22% higher rate of goal achievement.
Documenting KPI definitions is another critical step. Include the calculation formula, data source, and update frequency for each metric. This avoids misunderstandings – like differing definitions of a "qualified lead" between sales and marketing – and ensures consistency as your business grows.
Using Dashboards and Reporting Tools
Once your KPIs are aligned, use visual tools to track and analyze them. Dashboards offer real-time monitoring, while reports provide historical insights for strategic planning. Each serves a different purpose: your operations manager may rely on a live dashboard to track today’s order fulfillment rate, while your CFO uses monthly reports to analyze cost trends.
By 2026, Gartner predicts that over 80% of enterprises will use GenAI-enabled tools to automate data analysis. Modern BI tools let you ask plain-language questions like "Why did revenue drop yesterday?" and get instant visual answers. Stuart Kinsey, Co-founder of SimpleKPI, notes:
"The days of static, manually updated charts are rapidly fading. In 2026, the most effective KPI dashboards are moving from purely descriptive to predictive".
Centralized dashboards help teams build strong performance tracking habits. For example, a global customer success team used predictive analytics to identify at-risk accounts with 85% accuracy, four quarters in advance. This proactive approach retained $6.6 million in revenue. The dashboard flagged accounts with early warning signs like reduced product usage or late payments, enabling timely intervention.
Send KPI reports to stakeholders ahead of meetings so time is spent making decisions, not interpreting data. Poor data quality costs U.S. businesses over $3.1 trillion annually, so prioritize clean, automated data connections. Most KPI software is available via SaaS, with pricing based on users, data storage, or dashboards tracked. For small businesses, firms like TC Advisors can help implement affordable solutions that integrate with existing systems.
How to Review and Analyze Your KPIs
Once you’ve set up a structured process for tracking KPIs, the next step is to analyze them effectively. The numbers themselves are just the starting point. The real value comes from understanding what those numbers mean and how they can guide your next steps. As Landmark CPAs aptly put it:
"You cannot manage what you cannot measure".
But measurement alone isn’t enough. You need to evaluate performance systematically, identify patterns, and uncover problem areas.
Measuring Performance Against Benchmarks
Benchmarks provide the context that gives your KPIs meaning. They can be internal – like comparing this quarter’s revenue to last quarter’s – or external, where you measure your performance against industry standards. Tools like horizontal analysis (comparing financial statements over multiple years), vertical analysis (converting line items into percentages of revenue), and ratio analysis (comparing metrics to industry norms) can help you gain deeper insights.
Focus your benchmarking on critical areas such as Financial Performance, Operational Efficiency, Customer Experience, Innovation, and Organizational Health. For example:
- Tracking Net Profit Margin offers insights into operational efficiency.
- Comparing actual revenue to forecasts can reveal how accurate your projections are.
- Metrics like Profit Per Employee can show whether your staffing aligns with industry norms.
Here’s a quick breakdown of some key metrics and their purposes:
| KPI Category | Metric | Formula | Purpose |
|---|---|---|---|
| Financial | Revenue Growth | ((Current Period Revenue – Previous Period Revenue) / Previous Period Revenue) x 100 | Tracks sales momentum and competitiveness |
| Financial | Profit Margin | (Net Profit / Revenue) x 100 | Evaluates operational efficiency and pricing strategy |
| Customer | Net Promoter Score (NPS) | % of Promoters – % of Detractors | Measures customer loyalty and advocacy |
| Operational | Process Efficiency | (Value-Added Time / Total Cycle Time) x 100 | Highlights waste and streamlining opportunities |
It’s easy to get overwhelmed by too many metrics. Kamyar Shah, Fractional COO at World Consulting Group, warns:
"The problem isn’t a lack of metrics. It’s choosing the wrong ones".
Focusing on a limited number of key KPIs ensures that your team stays aligned and avoids chasing less meaningful data.
Spotting Trends and Variances
Once benchmarks are in place, the next step is to identify trends and variances over time. Comparing metrics week-over-week, month-over-month, or year-over-year can uncover seasonal patterns or sudden shifts.
To make this easier, use RAG (Red, Amber, Green) statuses to visually categorize performance. For instance, a KPI that’s slightly off-target might be marked amber, while significant underperformance would trigger a red alert. As Ted Jackson, Co-Founder of ClearPoint Strategy, says:
"What gets measured gets managed".
Define clear protocols for each status so your team knows exactly how to respond when performance dips. If a KPI shows unexpected changes, segment the data by source, channel, region, or customer type to pinpoint the issue. For example, if customer churn increases, breaking the data down by region or product line can help isolate the root cause.
A good balance between leading indicators (predictive metrics like sales pipeline coverage) and lagging indicators (outcome metrics like revenue) is crucial. A 60/40 split, favoring lagging indicators, works well for many organizations. Leading indicators give you an early warning, while lagging indicators confirm whether your actions are working. Companies that monitor KPIs in real time often achieve faster revenue growth and better profit margins.
Use statistical significance testing to ensure that any observed changes are meaningful, not just random fluctuations. While numbers show what’s happening, qualitative feedback from customers and stakeholders can help explain why.
Finding the Root Causes of Poor Performance
When a KPI underperforms, it’s tempting to apply a quick fix. But surface-level solutions rarely address the deeper issue. One effective approach is the "5 Whys" technique, which involves asking "why" repeatedly until the root cause becomes clear. For example, if customer churn is rising, you might find the real issue lies in delayed customer support responses.
Set up action triggers – specific thresholds that automatically prompt a review. Document these thresholds and protocols in advance so your team knows how to respond when a KPI hits a critical level.
Modern dashboards with drill-down capabilities can help you explore performance issues in detail. Start with high-level metrics and dig into the granular data to find where processes might be breaking down. Some AI tools can even automate this process, flagging anomalies and suggesting corrective actions based on historical data.
Monthly deep-dives are another effective way to analyze trends and identify root causes. These sessions should pull data from CRM, marketing, and finance systems to ensure your analysis is based on reliable information. Poor data quality costs U.S. businesses over $3.1 trillion annually, and sales teams often lose valuable time dealing with incomplete or incorrect data. Automating data integration can save time and improve accuracy.
When KPIs perform well, take the time to document the strategies that led to success. You can then apply these proven tactics to areas that need improvement. Adopting SMART KPIs (Specific, Measurable, Achievable, Relevant, Time-bound) can significantly boost your ability to achieve your goals. For smaller businesses, working with experts like TC Advisors can help create structured KPI systems that lead to measurable progress.
How to Improve KPI Performance
Improving KPI performance goes beyond identifying weak spots – it’s about translating insights into clear, actionable steps. As Ted Jackson, Co-Founder of ClearPoint Strategy, aptly states:
"Without targets, your KPIs are worthless".
Success starts with setting defined goals, creating structured action plans, and leveraging tools that predict challenges before they arise.
Setting Targets with SMART Goals
Vague goals yield vague results. That’s where the SMART framework – Specific, Measurable, Achievable, Relevant, and Time-bound – comes into play. It removes the guesswork and ensures clarity. For instance, instead of saying, "increase revenue", set a target like, "boost monthly recurring revenue by 15% in the next quarter by entering two new customer segments."
Start by identifying your "Point A" – your current performance metrics – and build realistic goals from there [27,31]. For example, if your net profit margin is 8%, aiming for 25% next quarter without significant changes is unrealistic. Aiming for a 2–3% improvement based on specific actions is far more achievable.
Balance your focus between leading indicators (predictive metrics like sales pipeline velocity) and lagging indicators (outcome metrics like revenue). A 60/40 split favoring lagging indicators often works well. However, only 30% of managers feel their teams fully understand the difference between these two types of metrics.
It’s also helpful to work backward from your long-term goals. For example, if you aim to hit $10 million in annual revenue within five years, break it down into annual, quarterly, and monthly milestones. Keep your focus sharp – companies with fewer than 10 company-wide KPIs are 1.5 times more likely to outperform competitors. Plus, using the SMART framework has been shown to increase goal achievement rates by 22%.
Before locking in any target, do a "sanity check" to ensure you have the necessary resources – budget, personnel, and team alignment [27,28].
Once your targets are set, the next step is crafting and executing a solid action plan.
Creating and Executing Action Plans
Clear targets are only the beginning. To make real progress, you need a structured action plan. The KPI Optimization Loop – a cycle of evaluating performance, identifying improvements, implementing changes, and measuring results – keeps your efforts on track.
Start with a root-cause analysis. When a KPI falls short, break down the data by source, region, or customer type. For example, if customer churn is rising, determine whether it’s limited to a specific product line or region. Tools like process mapping and benchmarking can help identify where things are going wrong.
Use a "Green, Yellow, and Red" system to manage thresholds and responses:
- Green: On or above target – document successes and share best practices.
- Yellow: Slightly below target – investigate causes (e.g., using the "5 Whys") and create a corrective plan within two weeks.
- Red: Significantly below target – hold an action planning session within 24 hours and monitor progress daily.
For example, a $15 million consulting firm improved its EBITDA margin from 3% to 19% by focusing on three key KPIs: Utilization Rate, Realization Rate, and Project Margin. By assigning clear ownership to each metric, utilization increased from 58% to 78%.
Regular reviews are critical. Quick 15-minute weekly check-ins for top KPIs, paired with detailed monthly reviews, ensure everyone stays aligned. As Jonathan Taylor from Klipfolio notes:
"The frequency of review often illuminates new and possibly more efficient paths to the same destination".
If a KPI falls short for three consecutive months, it’s time to reassess your long-term targets.
Once your action plans are in motion, predictive analytics can help you stay ahead of potential issues.
Using Predictive Analytics for KPI Optimization
Predictive analytics takes KPI management to the next level by shifting from reactive to proactive strategies. Instead of waiting for quarterly reviews, you can identify and address challenges – like customer churn or cash flow problems – before they snowball [10,11].
The main advantage of predictive analytics is early warning signs. For instance, if a model flags a drop in a customer’s engagement score, you can intervene with retention strategies before they leave.
Focus on leading indicators – metrics you can influence now to shape future results. Examples include sales pipeline velocity, website conversion rates, and customer health scores [5,10].
AI-powered anomaly detection adds another layer of precision. These systems can automatically highlight unusual patterns, like a sudden dip in monthly recurring revenue (MRR) or production efficiency, which might go unnoticed during manual reviews. For example, if customer engagement falls below a set threshold, the system could trigger a retention campaign within 48 hours [10,11].
One B2B SaaS company grew its annual recurring revenue (ARR) from $8 million to $25 million in just 18 months by simplifying 47 metrics into 7 core KPIs, including MRR and Net Revenue Retention (NRR). Predictive models helped them identify at-risk accounts early, boosting NRR from 95% to 118%.
You don’t need expensive tools to start. Even basic data from accounting software or spreadsheets can reveal trends [7,11]. A simple Red/Yellow/Green system offers instant visual feedback on whether you’re on track [5,10]. As your business grows, integrating systems like CRM and ERP can automate data collection and provide real-time dashboards.
Modern KPI systems are evolving into decision-support platforms. They not only report data but also suggest specific actions, like reallocating budgets or initiating recovery plans based on trends. For smaller businesses, services like TC Advisors can help integrate predictive analytics into your KPI strategy, offering tools like financial modeling and cash flow management.
The shift toward real-time monitoring is accelerating. By 2025, 64% of top-performing companies are expected to use automated dashboards for real-time KPI tracking – up from 42% in 2021. This move allows businesses to respond faster to emerging trends and make timely adjustments.
How Fractional CFO Services Support KPI Optimization
Regular KPI reviews can lead to significant improvements, but fractional CFO services take it a step further by bringing expert financial oversight into the equation. Managing KPIs effectively isn’t just about tracking numbers – it requires strategic financial expertise that many small and mid-sized businesses can’t afford in a full-time executive. That’s where fractional CFOs come in. They offer executive-level financial guidance at a much lower cost than hiring a full-time CFO, which typically costs far more. Fractional CFO services, on the other hand, generally range from $5,000 to $15,000 per month, making it a practical option for growing businesses.
The numbers back this up: 60% of small and mid-sized business owners admit they lack confidence in accounting and finance, while 90% report improved planning and accuracy with professional CFO leadership. This trend has fueled a 103% year-over-year increase in demand for fractional CFOs. By turning raw financial data into actionable insights, fractional CFOs complement KPI optimization efforts, helping businesses achieve smarter, growth-oriented decisions.
How Fractional CFOs Help with KPI Strategy
For most business owners, the problem isn’t a lack of data – it’s figuring out which metrics actually matter. As Kendra Moore, Owner and Expert CFO at Furever Bookkeeping, puts it:
"The difference between businesses that scale strategically and those that stumble? Fractional CFO expertise that turns data confusion into performance clarity."
Fractional CFOs zero in on the KPIs that truly align with a company’s goals, shifting the focus from backward-looking metrics to forward-thinking ones. Their real value lies in connecting these metrics to long-term objectives, ensuring everything from operating budgets to growth milestones – like market expansion or new product launches – is on track. Each business gets a tailored approach. For example, a manufacturing company might prioritize inventory turnover and production efficiency, while a service-based business focuses on Customer Acquisition Cost (CAC) and utilization rates.
Take the example of a custom kitchenware manufacturer in 2023. Despite earning $12 million in revenue, the company struggled with cash flow. After working with CFO Pro+Analytics, they introduced strategic KPI tracking, freeing up $2 million in cash and improving profit margins by 15% through smarter pricing. This financial overhaul also helped secure a $5 million lending facility, and within 18 months, the company doubled its revenue.
Fractional CFOs don’t just stop at identifying KPIs. They dig deeper into unit economics and resource efficiency to uncover hidden opportunities. Tools like a 13-week rolling forecast help businesses manage cash flow and anticipate liquidity needs. This is crucial, especially since 60% of small business owners cite cash flow management as their biggest challenge. By creating a clear KPI strategy, fractional CFOs provide the foundation for financial decisions that drive sustainable growth.
Improving Financial KPIs for Better Decisions
Once the right KPIs are in place, fractional CFOs shift their focus to optimization. They use multi-scenario forecasting to predict cash flow issues 8–12 weeks in advance.
To boost profit margins, they conduct detailed Cost of Goods Sold (COGS) analyses, renegotiate supplier contracts, and refine pricing strategies – all aimed at increasing revenue without losing competitiveness. Tax strategies also play a role, with many businesses seeing their effective tax rates drop 15% to 30% under expert guidance.
Working capital management is another priority. Fractional CFOs shorten Days Sales Outstanding (DSO) by enforcing payment terms, improving collections, and offering early-payment incentives to customers. They also work with vendors to extend payment terms without damaging relationships. For inventory-heavy businesses, strategies like just-in-time (JIT) systems or reorder-point methods can reduce storage costs and free up cash.
The results speak for themselves. Businesses that adopt fractional CFO services often see 15% to 25% revenue growth within 18 months. Additionally, better financial controls can cut fraud losses by 58% and reduce accounting errors by 42% in the first year.
TC Advisors exemplifies this approach, offering fractional CFO services tailored to industries like tech startups, real estate, retail, and hospitality. Using modern tools and secure digital dashboards, they transform financial data into actionable insights, enabling businesses to make smarter, faster decisions. Their services include financial modeling, cash flow management, and growth planning, all designed to adapt to shifting market conditions.
Unlike reactive bookkeeping, fractional CFOs provide real-time financial insights that allow businesses to pivot strategically when needed. They stress-test various scenarios to identify vulnerabilities early and conduct regular audits of fixed costs to protect profit margins. By focusing on rolling budgets that adjust monthly or quarterly, rather than static annual plans, every financial decision is aligned with long-term business goals.
Conclusion
Regularly reviewing and refining your KPIs isn’t just a box to check – it’s a game-changer. Companies that consistently track and adjust their performance metrics see up to 50% improvement in decision-making quality and achieve 62% faster revenue growth with 97% higher profit margins through real-time monitoring.
The secret? Staying focused. As Kamyar Shah, Fractional COO and CMO at World Consulting Group, explains:
"Focus is the ultimate competitive advantage".
To maintain that focus, it’s essential to streamline your dashboard, assign clear ownership for each metric, and establish consistent review schedules. For example, operational metrics might be reviewed weekly, executive-level KPIs monthly, and strategic goals quarterly.
Start small. Instead of overwhelming your team with a flood of data, begin with 2–3 KPIs tied to a single strategic goal. Using the SMART framework can help boost goal achievement by 22%. Set clear action thresholds – like "Red/Yellow/Green" indicators – so your team knows exactly when and how to respond if performance starts slipping. This structured process creates a continuous cycle of improvement, ensuring your KPIs remain actionable and effective.
When your internal efforts hit a ceiling, bringing in outside expertise can make all the difference. If turning raw data into actionable insights feels overwhelming, fractional CFO services can provide the clarity you need. TC Advisors specializes in helping small to mid-sized businesses, startups, and real estate investors build KPI systems that drive smarter decisions. Their services – ranging from financial modeling to cash flow management and growth planning – leverage modern tools to turn data into a clear, strategic path forward.
FAQs
How do I choose the right KPIs for my business?
When selecting KPIs, it’s important to focus on metrics that directly align with your strategic objectives, whether that’s driving growth, improving customer retention, or something else entirely. The key is to pick indicators that are measurable, actionable, and based on reliable data you already have access to.
Start small – choose a manageable number of KPIs to keep things clear and avoid feeling overwhelmed. Too many metrics can dilute focus and make it harder to act effectively. Also, don’t treat your KPIs as set in stone. Regularly review and adjust them to ensure they stay relevant as your business priorities or market conditions shift.
By sticking to clear and relevant KPIs, you’ll gain the insights needed to make informed decisions and keep your strategies on track.
What’s the best KPI review cadence for my team?
The right schedule for reviewing KPIs varies based on your business’s specific needs, the complexity of operations, and the metrics you’re tracking. However, many teams find a combination of weekly, monthly, and quarterly reviews works best:
- Weekly: Keep an eye on leading indicators like cash flow or accounts receivable. These reviews help you catch and resolve issues before they escalate.
- Monthly/Quarterly: Dive into broader trends, evaluate financial performance, and assess progress toward strategic goals. These sessions are key for making informed, long-term adjustments.
When should I hire a fractional CFO to improve KPIs?
When your business hits revenue between $500,000 and $1 million, it might be time to think about bringing on a fractional CFO. This can be particularly helpful if you’re dealing with challenges like unexpected cash flow issues, limited financial data for making decisions, or gearing up for fundraising or a merger and acquisition. Other indicators? Struggling to answer critical financial questions, outgrowing the capabilities of your current financial team, or needing the expertise of a CFO without the expense of a full-time hire.


